

1st Steps
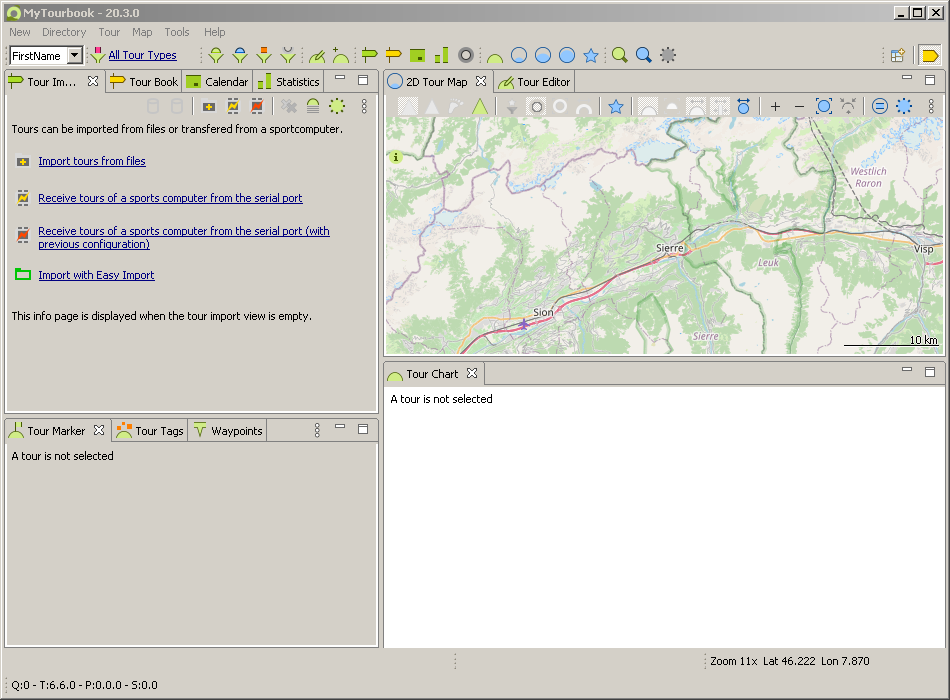
1. Startscreen
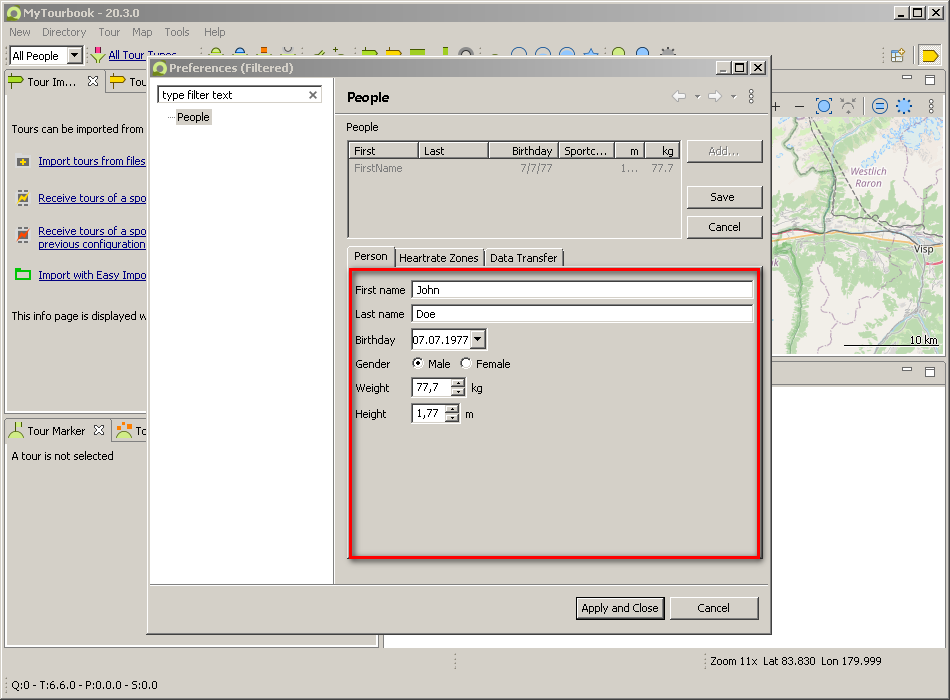
2. Input user name and dates
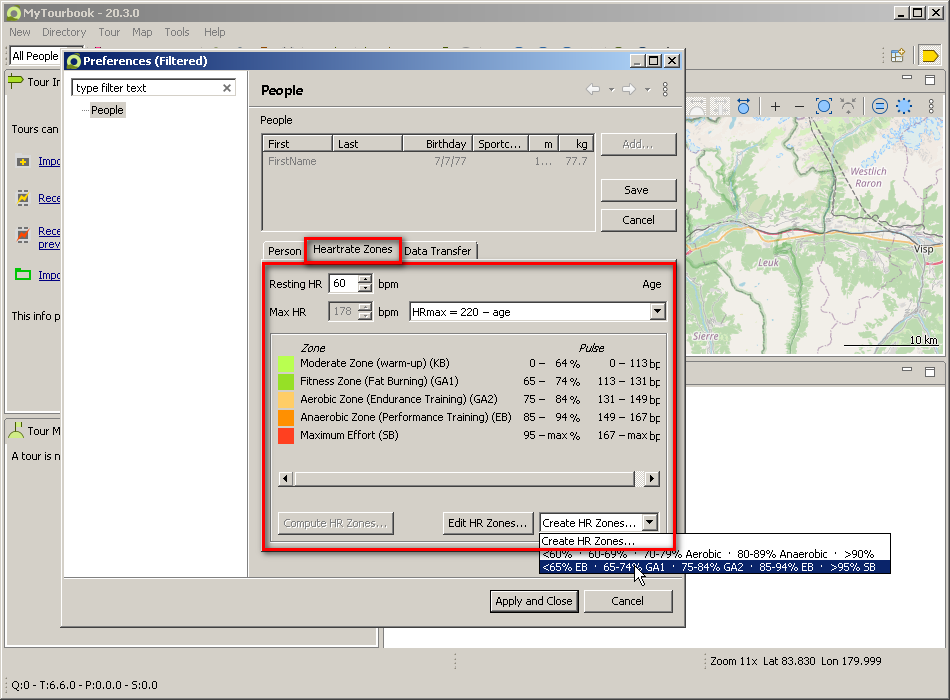
3. Create 'Heartrate Zones' (optional)
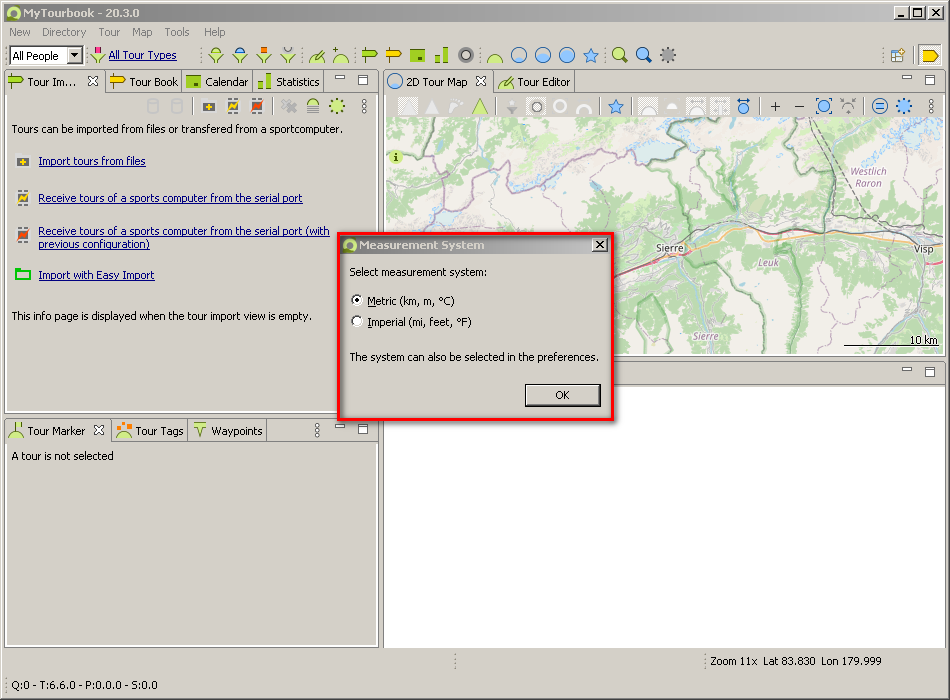
4. Select measurement system
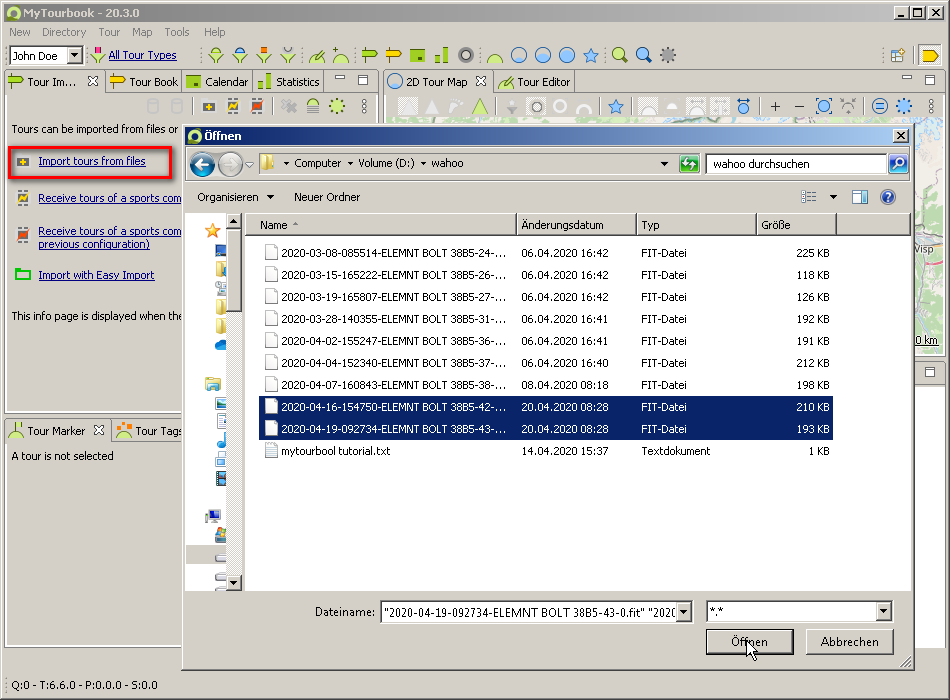
5. Import tours from files
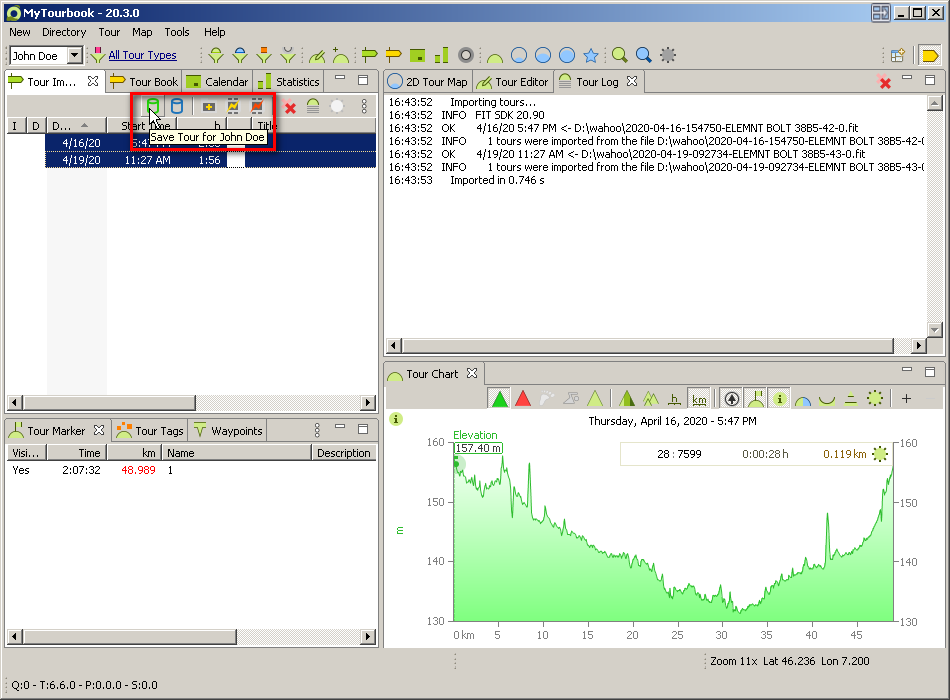
6. Save tour for user
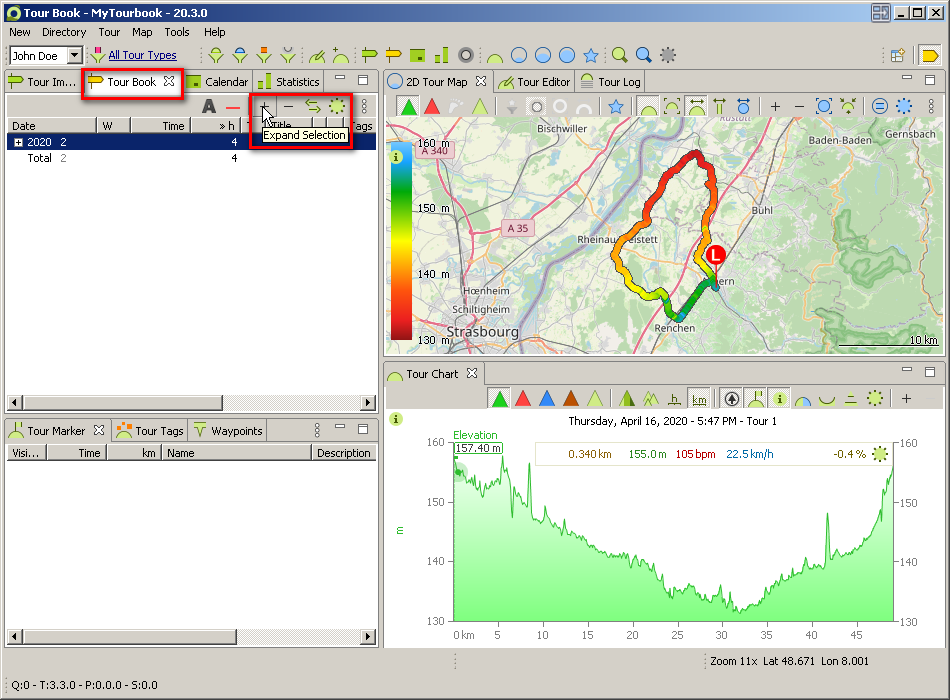
7. Switch to 'Tour Book' and expand selection
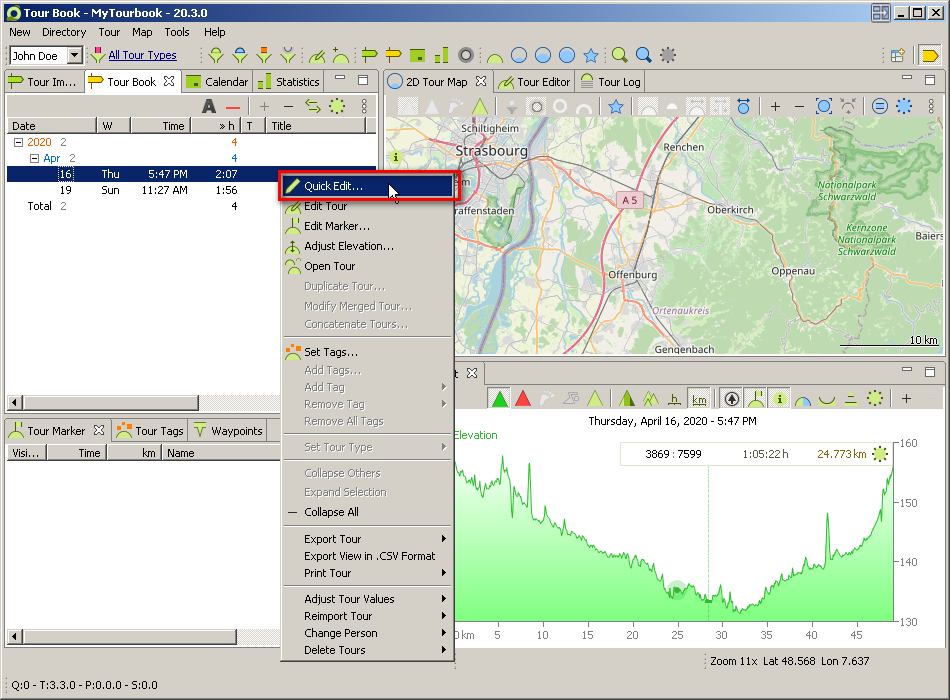
8. Open 'Quick Edit' with RightMouseClick or LeftDoubleClick
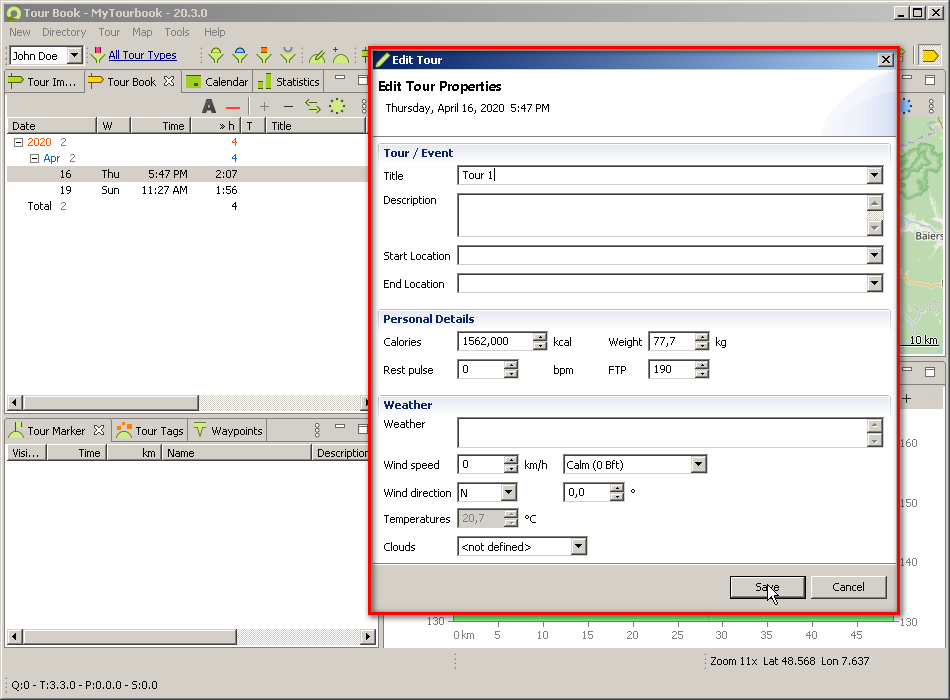
9. Edit tour properties
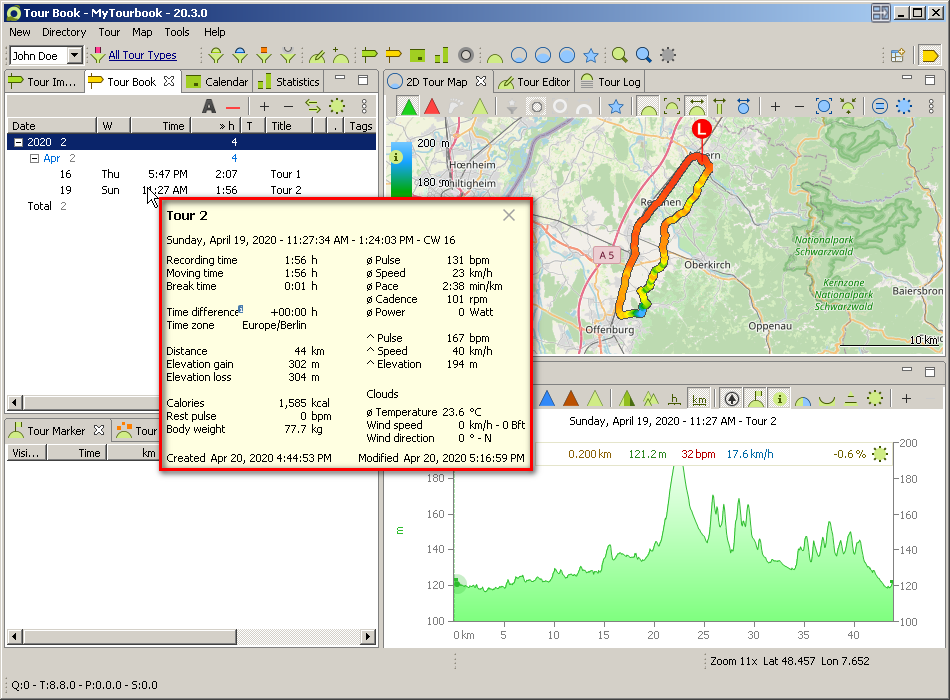
10. Show tour info as tooltip
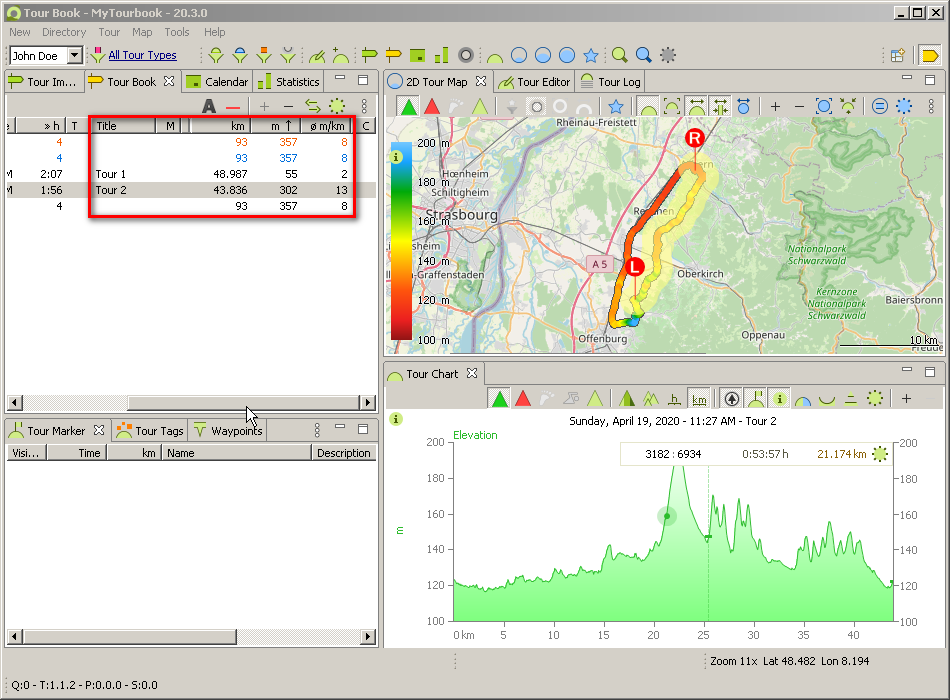
11. Show summary of multiple tours
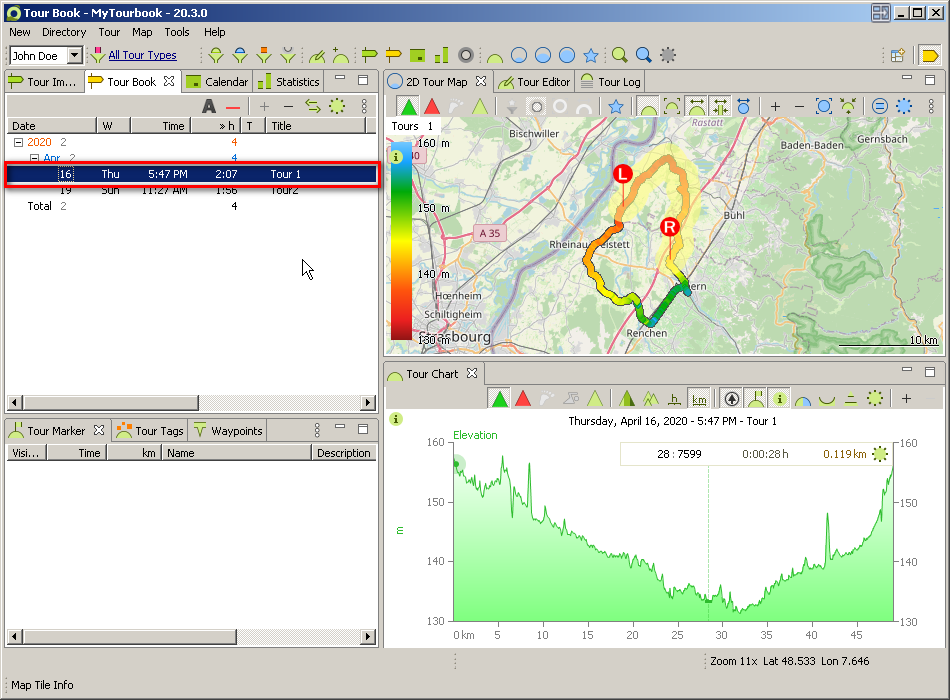
12. Show tour 1
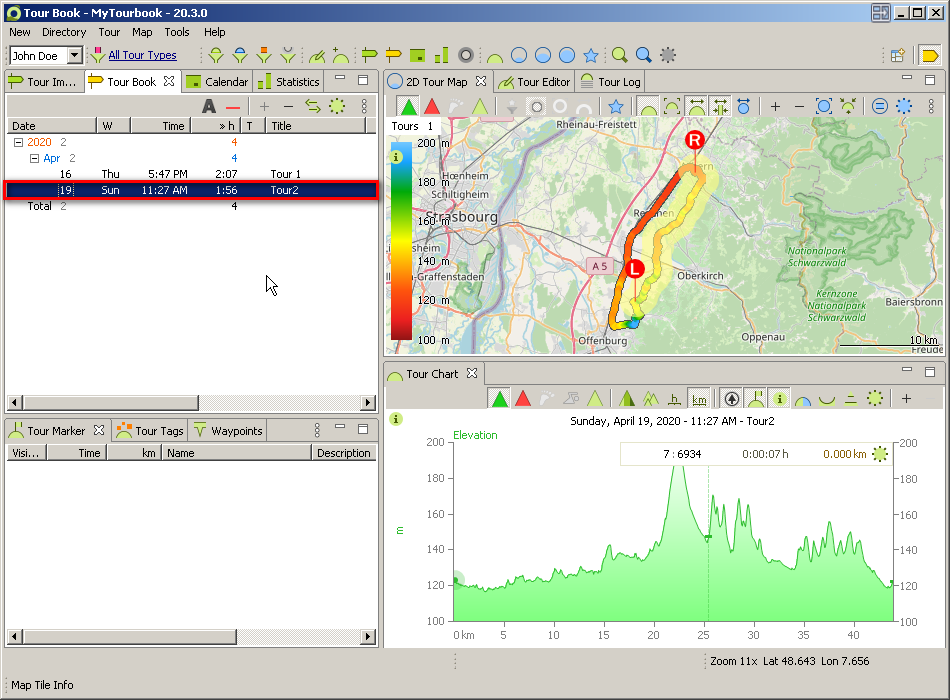
13. Show tour 2
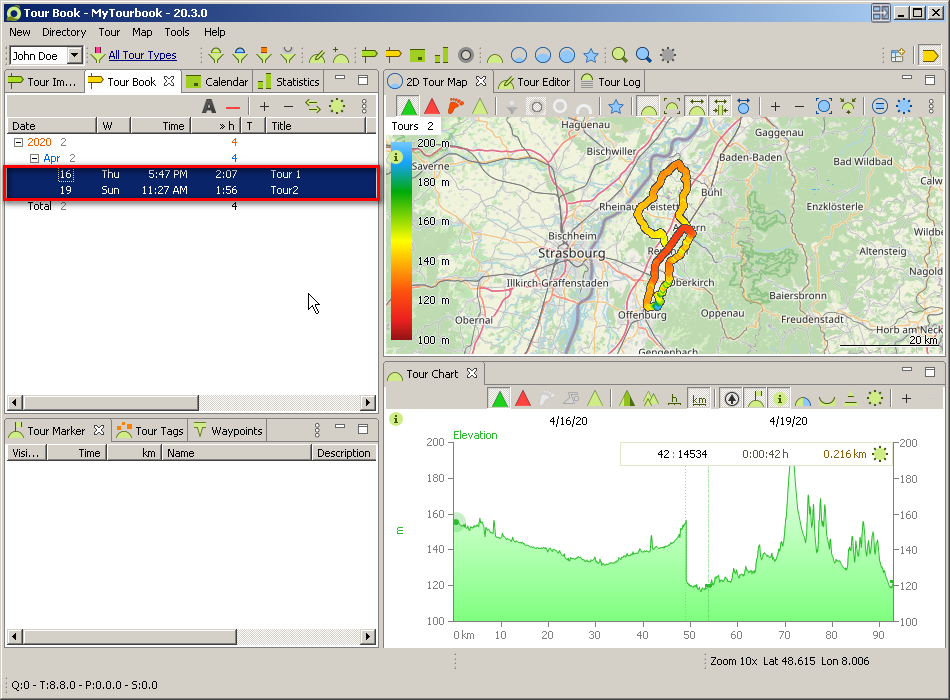
14. Show tour 1 and 2
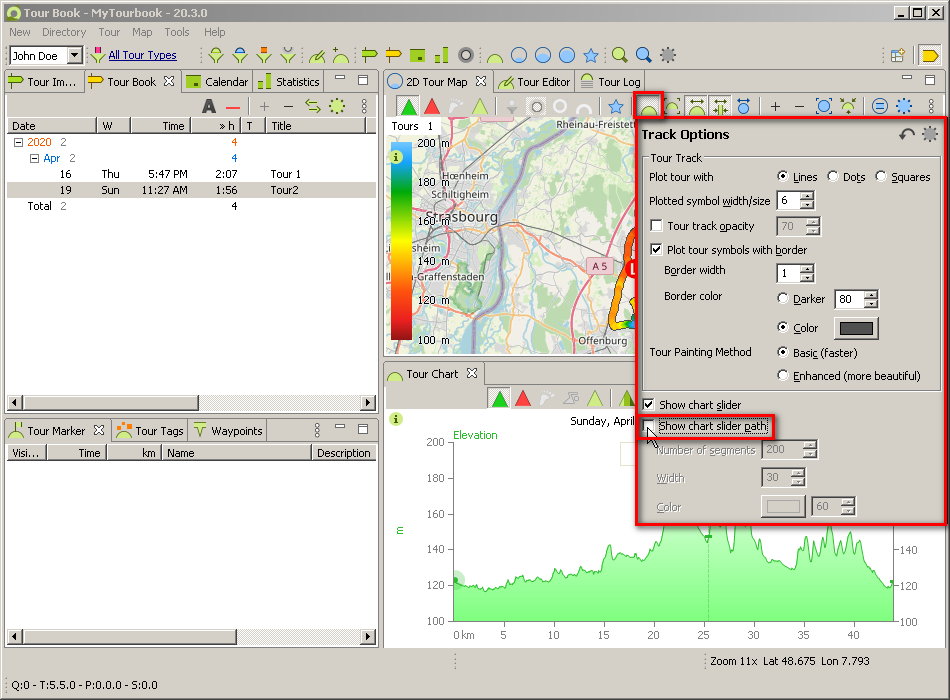
15. Hide the yellow sliderpath (optional)
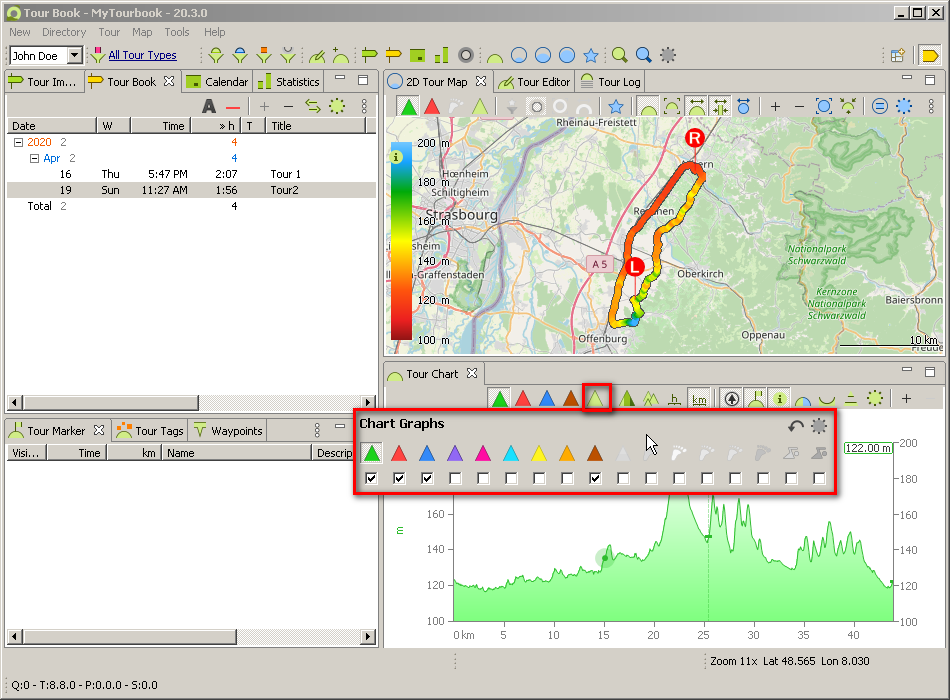
16.Select the desired chart graphs
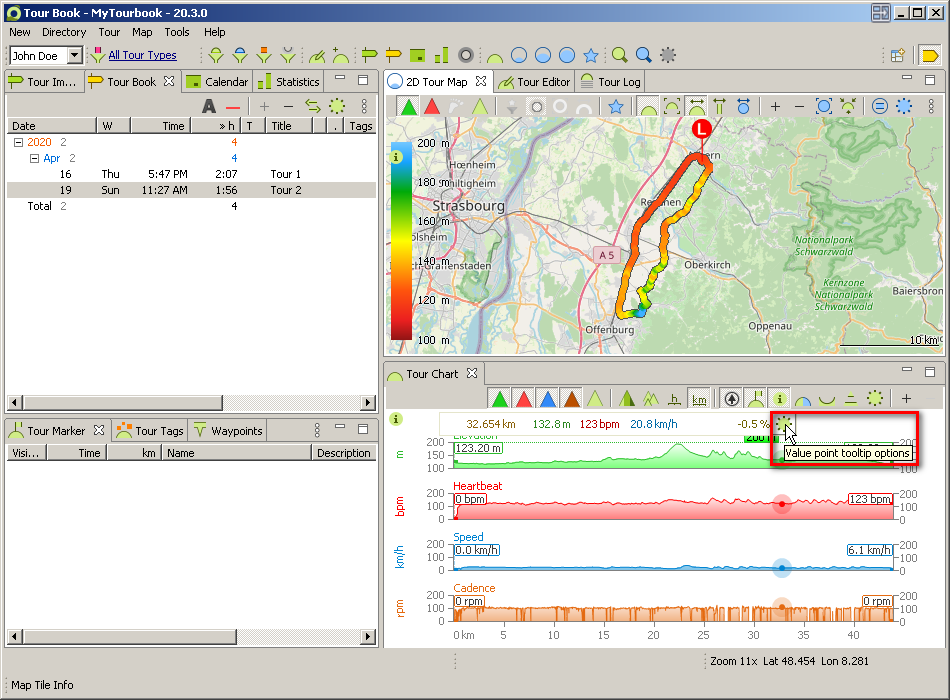
17. Modify the value point tooltip (optional)
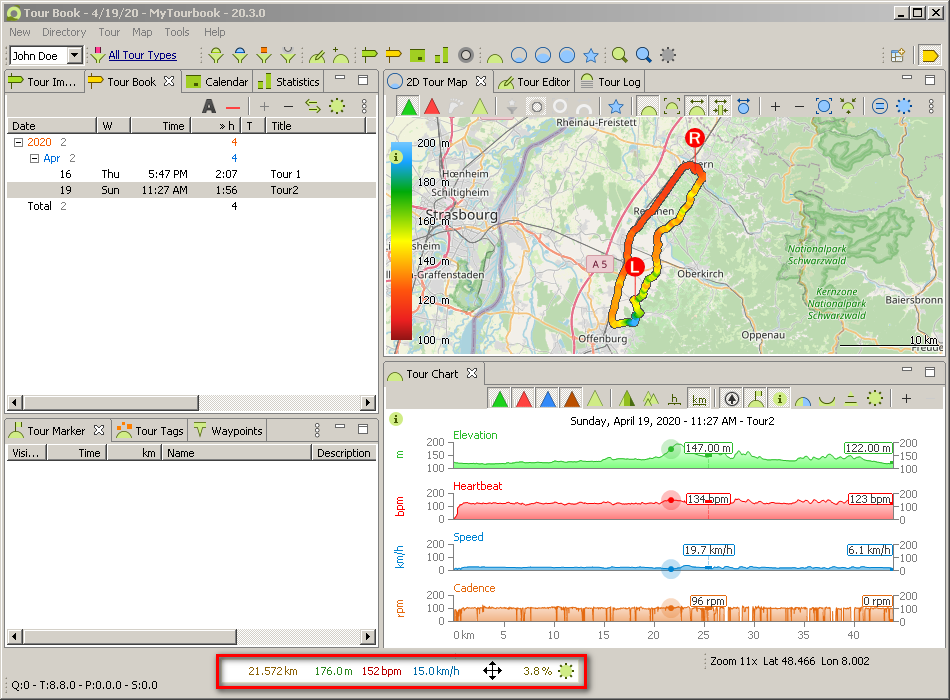
18. Move 'Value point tooltip' to the bottom of the screen (optional)
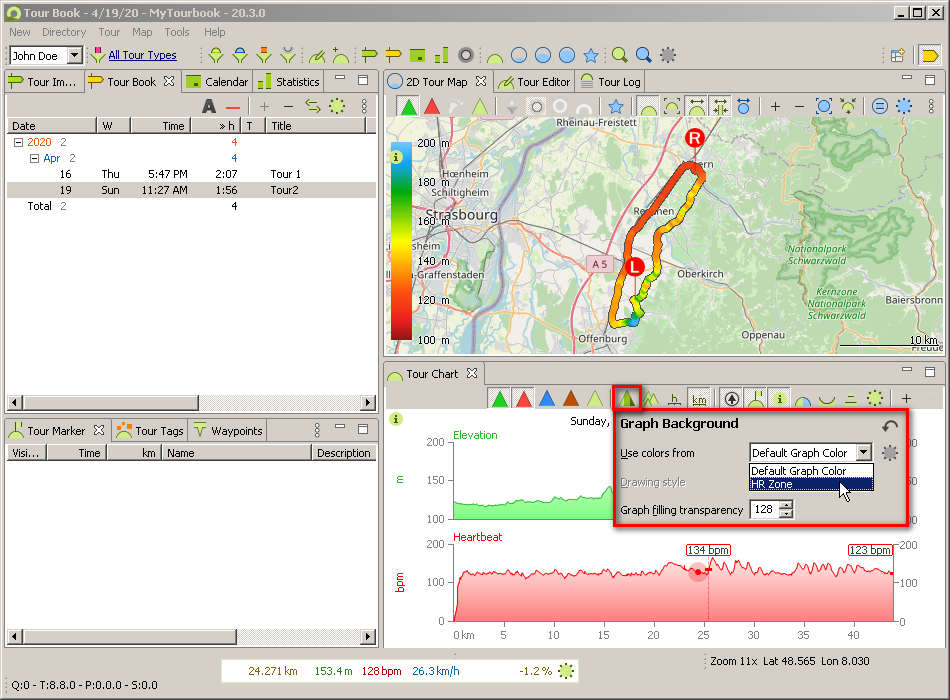
19. Change 'Graph Background' to HR Zone (optional)
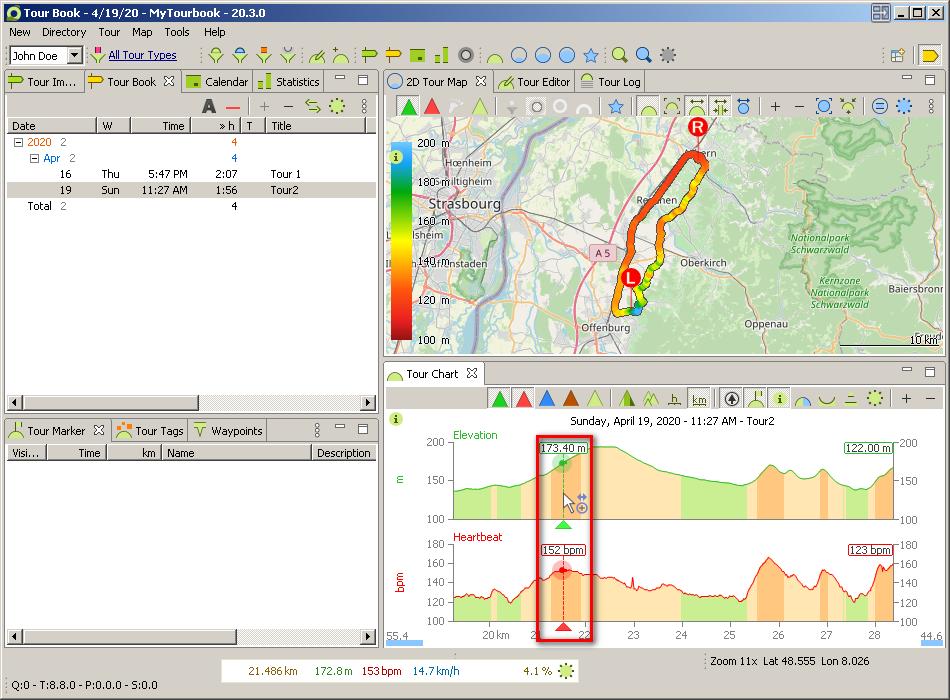
20. Move the left slider with the mouse pointer in the graph to get informations
21. Change 'Tour Colors' to HR Zone (optional)
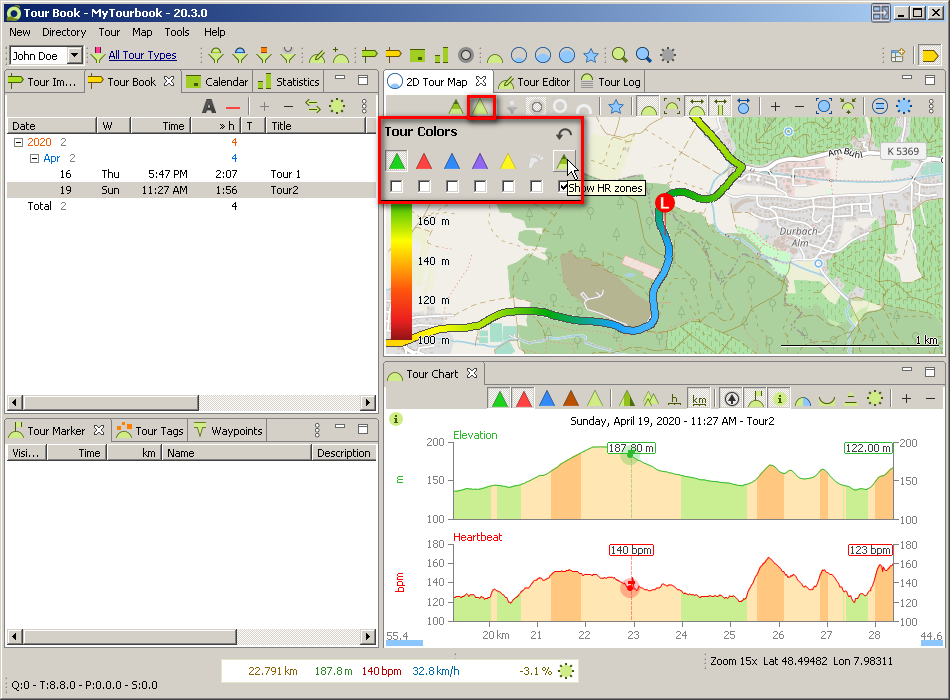
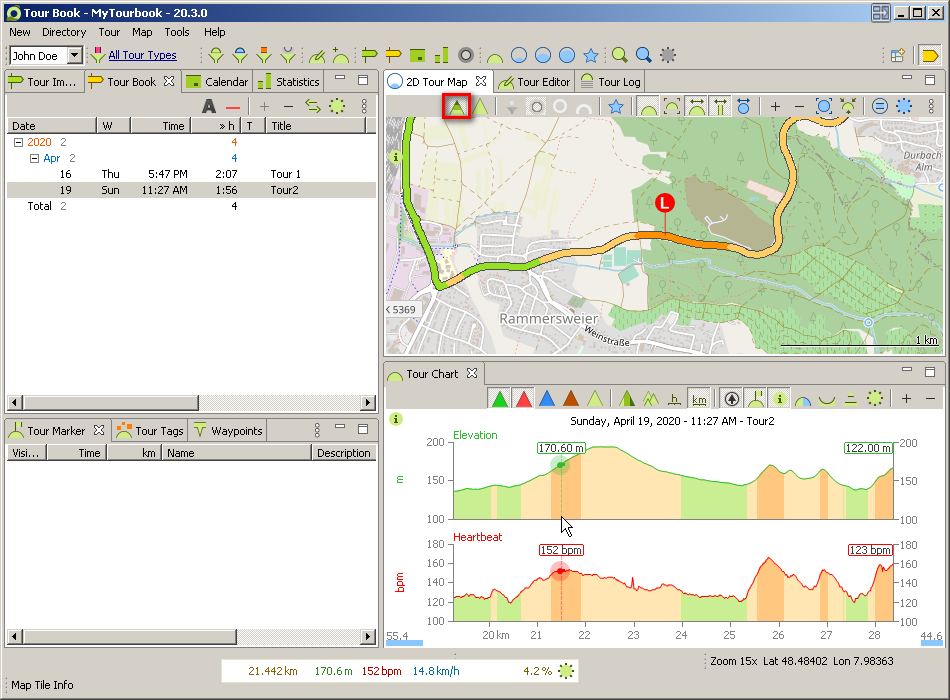
22. Show detail of the tour (tour color: HR Zone)
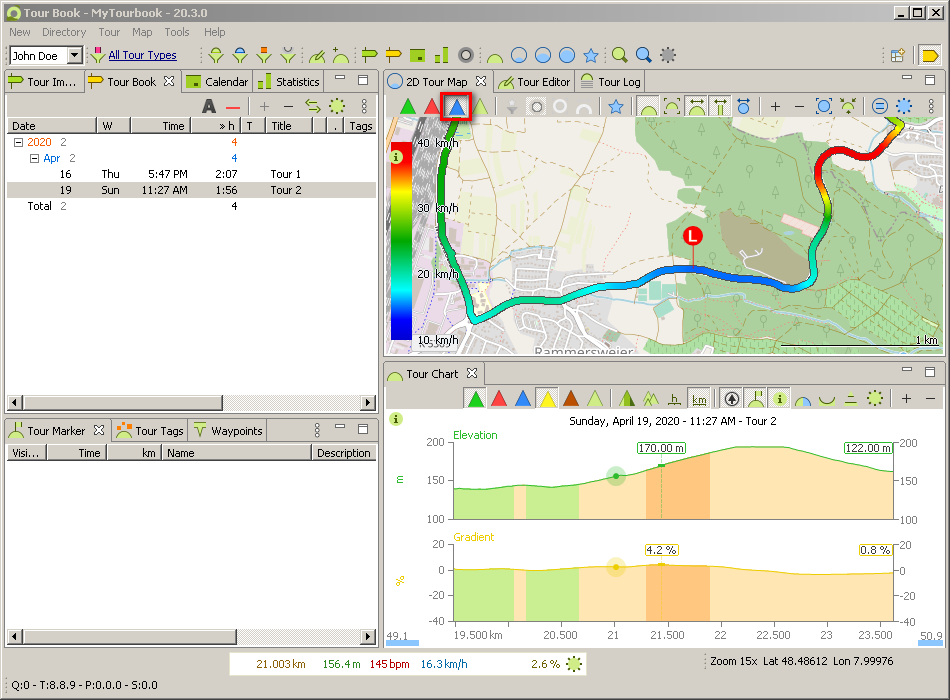
23. Show detail of the tour (tour color: speed)
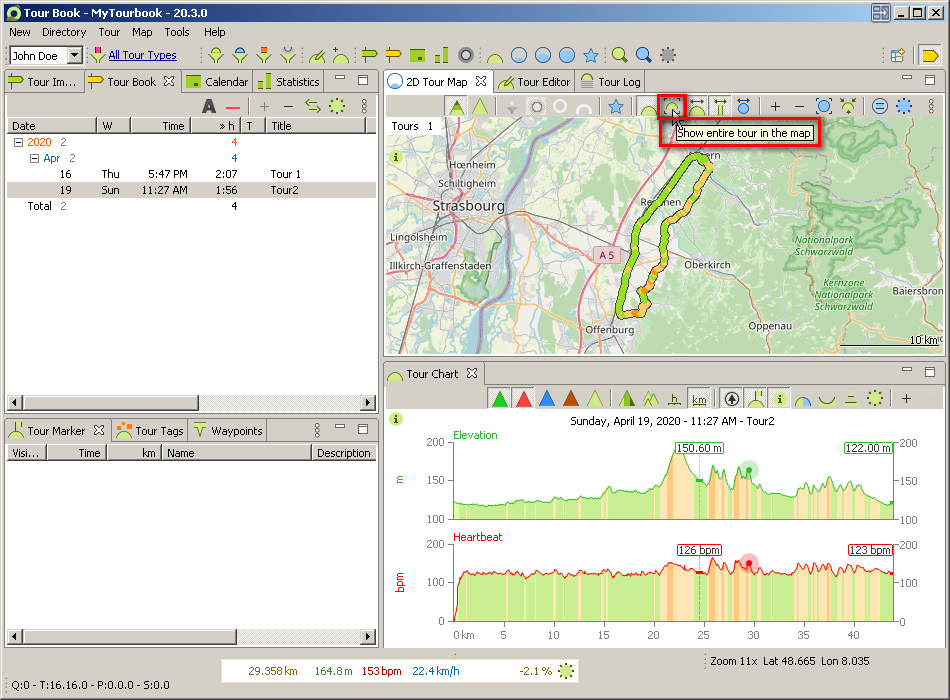
24. Show entire tour in the map
Have fun
(Rudolf Martin 22. April 2020)
