 Graph Colors
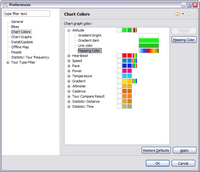
The color which is used to display the tour values, can be customized.
Tour in a chart
The tour values are displayed in a chart with a filled gradient with these parameters:
|
Gradient bright |
Color is used at the top of the graph. |
|
Gradient dark |
Color is used at the bottom of the graph. |
|
Line color |
Color is used to draw a line at the value position. |
Tour in a map
The tour values are displayed in the map with the mapping color:
|
Mapping color |
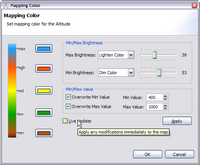
According to the tour value, the tour can be displayed with different colors which can be customized in the Mapping Color Dialog. |
Mapping Color Dialog
All tour values have always a minimum and a maximum value, e.g. the altitude can be in the range 442 m and 854 m.
The color can be set for 5 values:
- Maximum
- High
- Middle
- Low
- Minimum
the high value is the middle between the middle and maximum value and the low value is the middle between the middle and the minimum value
A gradient is painted between the 5 values.
Min/Max Value
The minimum and maximum values are computed from the tour values and it makes sense to use the computed values for the altitude because each tour can have total different min/max values.
But for the heartbeat or gradient, the values are mostly in the same range and can be visualized for a specific range, e.g. 120-150bpm.
With the checkboxes Overwrite Min Value and Overwrite Max Value a range can be specified which is used when the tour values are painted.
Min/Max Brightness
When the Min/Max Value's are defined, a tour value can be lower or higher then the min/max value. For these values, the brightness can be specified how to paint the tour value, with the slider the effectiveness can be changed.
Live Update/Apply
When Live Update is checked, any modifications will be applied immediately to the map, when unchecked, the modifications can be applied with the Apply button.


