

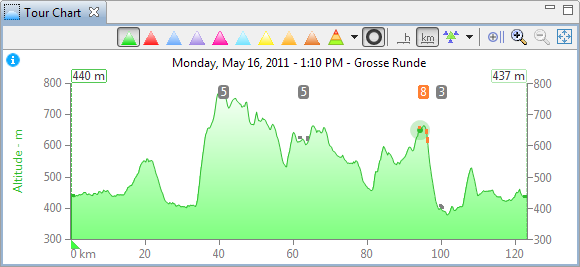
 Tour Chart
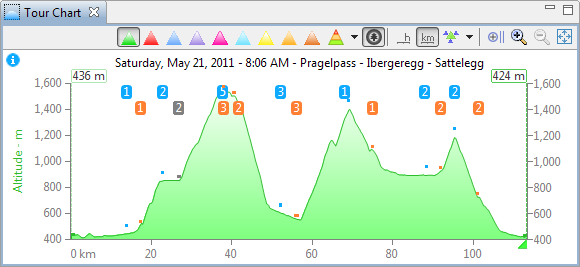
The tour chart visualizes data of a tour which is recorded by a device, it can be opened in the toolbar or menu Tour/Tour Chart.
Some graphs show the recorded data and some show computed values. The computed values depend all on the distance which have a tolerance. Distance in GPS devices have a tolerance also, therefore the computed values will never be exactly correct.
Content
Graphs
Actions
Mouse Behaviour
Keyboard Navigations
Tour Info
Zoom Marker
Tour Marker
Photo Marker
Designations
|
Vertical slider |
Slider from top to bottom |
|
Horizontal slider |
Slider from left to right |
|
Chart area |
Whole visible area in the tour chart view |
|
Graph area |
Every displayed graph in the chart has it's own graph area when they are not overlapped |
|
Area at the left and right border of the chart, in this area the y-axis units and graph titles are displayed |
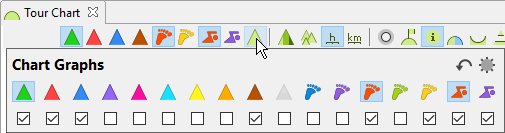
Graphs
The graphs are displaying different values for the tour. Graph buttons can be disabled when data are not available.
In the chart graphs slideout, the graph actions can be selected which are displayed in the tour chart toolbar.
|
|
Graph |
Displayed data |
|---|---|---|
|
|
Altitude |
Device data |
|
|
Pulse |
Device data |
|
|
Speed |
Device data when the data source is an ergometer otherwise computed values |
|
|
Speed ∑ Ø |
Summarized average speed from the tour start 205 |
|
|
Pace |
Computed values |
|
|
Pace ∑ Ø |
Summarized average pace from the tour start 205 |
|
|
Power |
When the data source is an ergometer, the power from the ergometer is displayed otherwise the power is computed and can't be very exact because the power depends on the gradient and speed and these data are also computed |
|
|
Temperature |
Device data |
|
|
Gradient |
Computed values |
|
|
Altimeter |
Computed values |
|
|
Cadence |
Device data |
|
|
Gears |
Device data, see here |
|
|
Stance time |
|
|
|
Stance time balance |
|
|
|
Step length |
|
|
|
Vertical oscillation |
|
|
|
Vertical ratio |
|
|
|
Swim strokes |
|
|
|
Swolf |
|
|
|
Overlapped graphs |
The first graph which is added as the main graph and it's background color is more opaque. The vertical scale is displayed from the graph which is added as last. |
|
|
Graph Background |
see below |
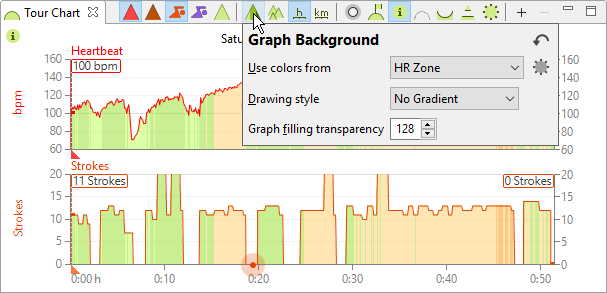
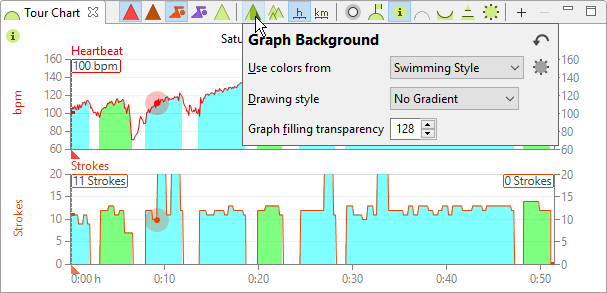
Graph Background
The graph background can be filled with colors from different sources.
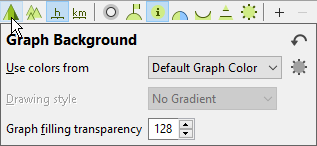
Background with default graph colors from here
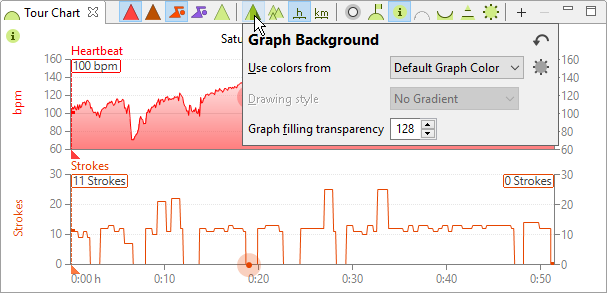
Background with HR zone colors from here
Background with swim style colors from here
Actions
Some global actions are available which are described here.
Toolbar Actions
|
|
Show/hide photos |
|
|
|
Show/hide tour marker |
See below |
|
Show/hide tour info |
See below |
|
|
Setup chart smoothing |
See below |
|
|
Graph min/max values |
See below |
|
|
Setup chart options |
See below |
|
|
|
X-Axis Time |
Shows time on the x-axis, when time is already displayed the button can toggle between:
|
|
|
X-Axis Distance |
Shows distance on the x-axis, when a distance is not available this action is disabled |
|
|
Toggle Mouse Wheel Mode |
With the mouse wheel the chart can be zoomed or the vertical sliders can be moved. The mouse wheel mode can be toggled with <Ctrl>-Doubleclick into the chart. |
|
|
Fit graph to window |
Shows the whole tour in the chart without any restrictions (minimum heights are ignored) |
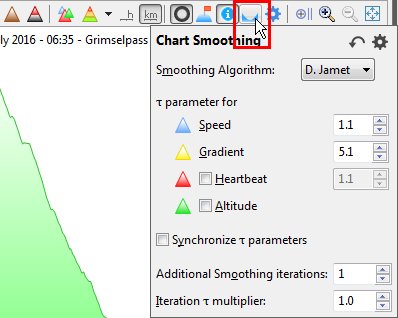
Chart Smoothing
The chart smoothing tool can be used in a slideout.
Graph Min/Max Values
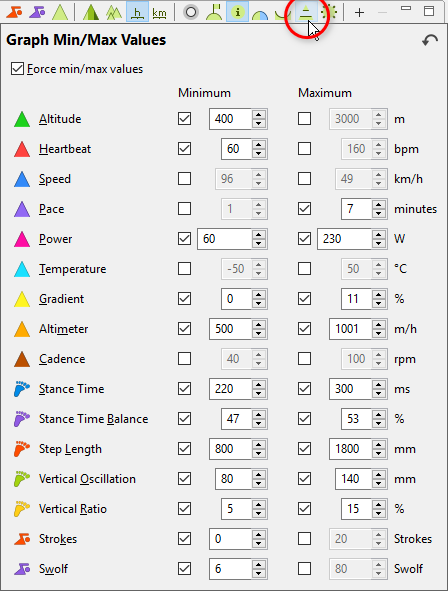
Features
|
Force min/max values |
When a tour is displayed in the tour chart, the minimum and/or maximum values for the checked graphs will be forced. When min/max value is enforced but the data min/max value is larger/smaller than the forced min/max value, the data min/max value is used. |
Chart Options
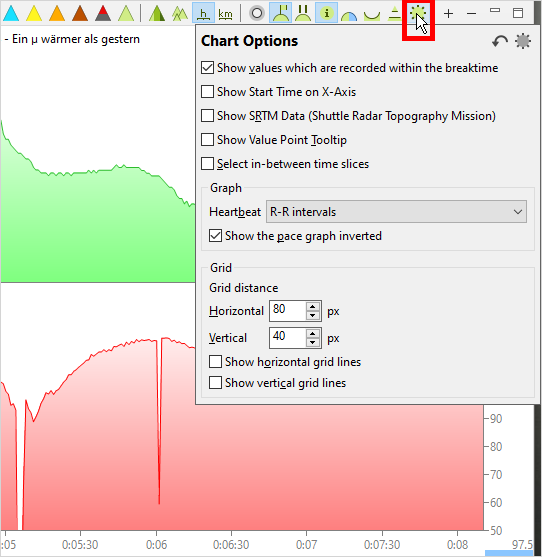
|
|
Chart Options |
Additional chart options |
|
Show values which are recorded within the breaktime |
Show/hide graph values which are recorded in the breaktime, these values are painted with dots outside of the graph line
|
|
|
Show Start Time on X-Axis |
When the x-axis shows the time of the tour, this action toggles between the absolute and relative time
|
|
|
Show SRTM Data |
When the tour contains GPS data, the chart displays also the SRTM elevation within the altitude graph (as red line)
|
|
|
Show Value Point Tooltip |
Show/hide value point tooltip
|
|
|
Select in-between time slices |
Selects all the time slices in the Tour Editor view between the left and right sliders
|
|
|
Heartbeat |
|
|
|
Show pace graph inverted |
|
|
|
Grid |
Setup chart grid, this is the same as in the preferences
|
|
|
|
Edit Chart Preferences |
Edit preferences for the tour chart |
Context Menu Actions
Common Actions
|
|
Create Marker |
Create a marker at the current horizontal mouse position |
|
|
Zoom to vertical sliders |
This will zoom the chart between the vertical sliders (this behaviour was the zoom in action in MyTourbook 1.5.0 or older) |
|
|
Toggle Mouse Wheel Mode |
With the mouse wheel the chart can be zoomed or the vertical sliders can be moved |
|
|
Move Sliders to Border |
Moves the sliders to the left and right border |
|
|
Move Left Slider here |
Moves the left slider to the mouse position |
|
|
Move Right Slider here |
Moves the right slider to the mouse position |
Actions when mouse is hovering a vertical slider
|
|
Create a marker at the vertical slider position |
|
|
|
Create Reference Tour |
Create a reference tour between the 2 vertical sliders |
|
|
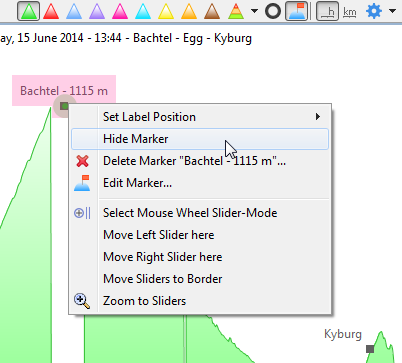
Edit Marker... |
Open tour marker editor |
Actions when mouse is hovering a tour marker
|
|
Set Label Position |
Set a horizontal/vertical position of the label text. * |
|
|
Hide Marker |
Set marker hidden. * |
|
|
Set Marker Visible |
Set marker visible. * |
|
|
Delete Marker "???"... |
Delete the hovered marker. * |
|
|
Edit Marker... |
Open tour marker editor |
*) These actions will save the tour marker and the tour, it also will updates all views. When doing multiple modifications, it is much faster to do it in the tour marker editor.
Mouse behaviour
Depending on the mouse position and the activated features, the mouse cursor shows the different behaviour for the mouse wheel and left mouse button.
|
Mouse wheel is in slider mode, the mouse wheel will move the active vertical slider |
|
|
|
Mouse wheel is in zoom mode, the mouse wheel will zoom in and out the chart |
|
|
Move vertical slider with hovered mouse When the mouse is located in the upper or lower vertical part of the chart, the left mouse button click will move the leftmost vertical slider to the current mouse position and the vertical slider is pinned to the mouse until the mouse button is clicked again |
|
|
Same behaviour as above except that the rightmost vertical slider is moved |
|
|
Mouse is hovered over a vertical slider, there are 2 vertical sliders in each displayed graph. When the left mouse button is clicked, the vertical slider is pinned to the mouse horizontal position until a second mouse button is clicked. Hint for using Tour Chart and Map When a dragged vertical slider in the tour chart is not moving the slider in the map, ensure that the tour chart has the focus by clicking at the tour chart tab and not in the tour chart itself. |
|
|
Mouse is hovered over a horizontal slider which is located at the top and bottom of a graph in the tour chart. when the left mouse button is pressed and hold down, the horizontal slider can be dragged in the vertical direction. |
Autoscroll when tour chart is zoomed in
|
|
When the mouse is positioned in the zoom position marker area the chart is automatically scrolled until the left or right border of the tour is reached, this behaviour applies also when a vertical slider is dragged. The autoscroll speed depends on the mouse horizontal position within the y-axis area. A side effect of this behaviour is, that an animation can be done for the tour in the chart and in the map when a vertical slider is dragged, the <Home> or <End> key can restart the animation. |
Mouse zoom position
When zooming the chart in or out with the mouse wheel, the horizontal position of the chart will be preserved where the mouse is located (in versions before 12.1 the last mouse double click position was preserved, this is still the behaviour in the map).
Panning the Chart
The chart can be panned in horizontal direction when the left mouse button is pressed and hold and the mouse is moved, it requires that the chart is zoomed in.
Panning in vertical direction is not possible, the vertical units are automatically adjusted when panning in horizontal direction.
Zoom & Pan Mode
In this mode the chart can be zoomed or panned with the mouse wheel. This is the default mode which can be set in the preference dialog
|
Interface |
Description |
|---|---|
|
Doubleclick |
Centers this position in the graph, requires that the chart is zoomed in |
|
Mouse wheel |
Zoomes the chart in and out, the vertical units are adjusted automatically to fill the whole visible area with the visible graphs |
|
Alt + Mouse wheel |
Same as above but with smaller steps |
|
Ctrl + Mouse wheel |
Pans the chart, this requires that the chart is zoomed |
|
Shift + Mouse wheel Ctrl + Shift + Mouse wheel |
Pans the chart with bigger steps |
|
Ctrl + Doubleclick |
Switches to mouse slider mode |
|
Mouse Thumb button |
Displays the whole tour in the chart |
Hint: The chart is recomputed for each mouse wheel move. The performance can be improved by reducing the visible graphs in the chart and to use a small window size. The visible graphs also influence the performance, the altitude graph is faster displayed compared with the cadence graph because the cadence has more lines which needs to be drawn.
Slider Mode
In the slider mode the vertical sliders can be moved with the mouse wheel (this is the behaviour in MyTourbook 1.5.0 or older)
|
Interface |
Description |
|---|---|
|
Mouse wheel |
Moves active slider, the slider is moved for one data point |
|
Ctrl + Mouse wheel |
Moves the slider for 10 data points |
|
Ctrl + Shift + Mouse wheel |
Moves the slider for 100 data points |
|
Shift + Mouse wheel |
Toggles the active slider |
|
Doubleclick |
Switches to mouse mode zoom&pan and zoomes into the chart |
|
Ctrl + Doubleclick |
Switches to mouse mode zoom&pan |
Keyboard Navigation
The chart can be navigated with the keyboard and is wrapped at the start and end
|
Key |
Description |
|---|---|
|
Ctrl |
Toggle active slider |
|
Right/Left Arrow |
Moves active slider to the end/start |
|
Ctrl + Right/Left Arrow |
Moves active slider the the end/start for 10 data points |
|
Ctrl + Shift + Right/Left Arrow or |
Moves active slider the the end/start for 100 data points |
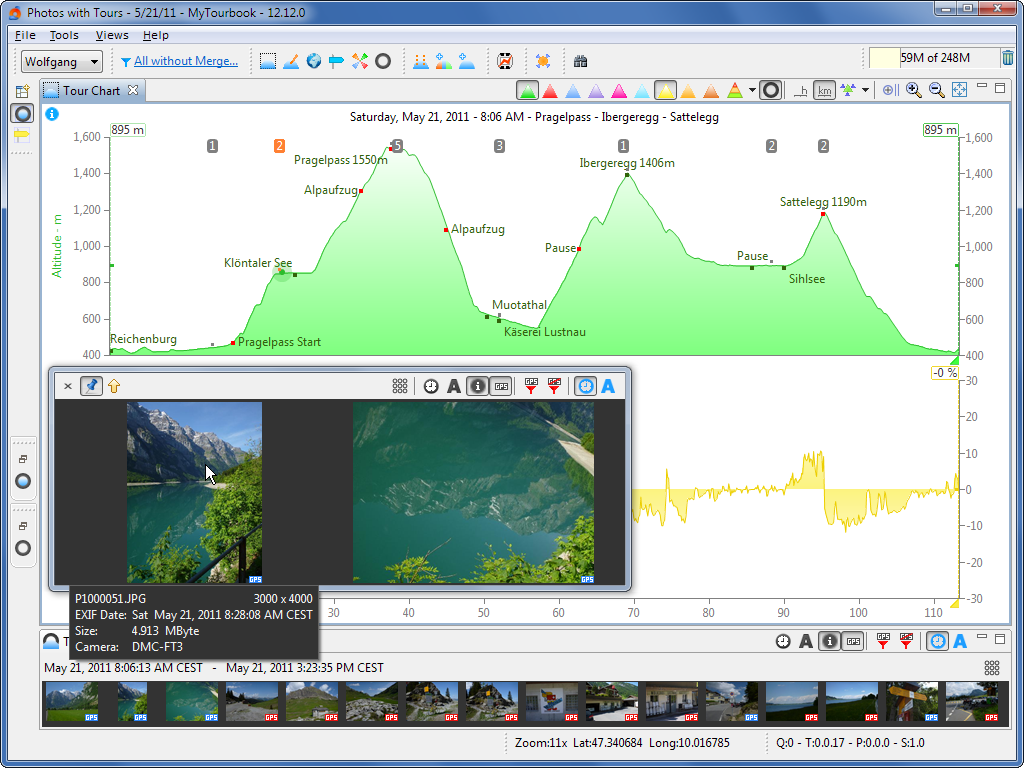
Tour Info
Tour info can be activated with this ![]() action in the chart toolbar.
action in the chart toolbar.
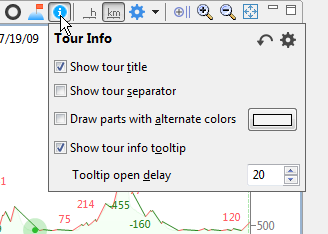
Tour Info Tooltip
The tour info tooltip is displayed
-
When tour info tooltip is activated in the tour info properties

- When the tour title area is hovered with the mouse

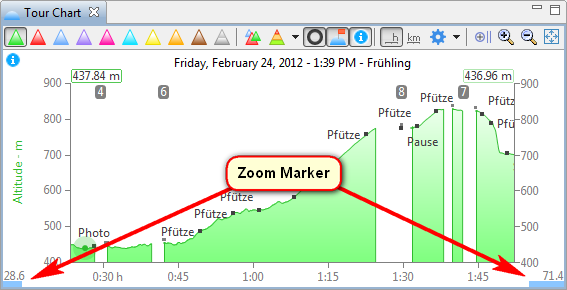
Zoom Marker
These markers are only displayed, when the chart is zoomed in.
They show, how far the visible part of a tour (these are the graphs which are displayed in the tour chart) is panned to the right or left side. It also gives you the info, if a chart is zoomed in or not, which is very helpfull when a History Tour is displayed.
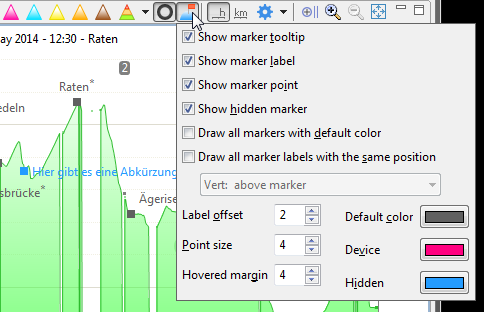
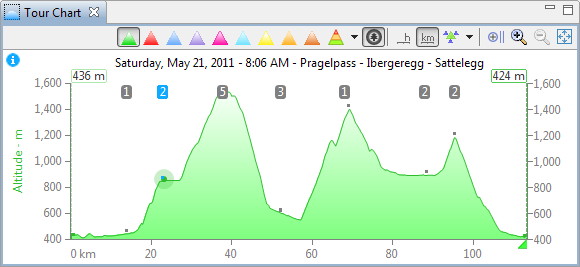
Tour Marker
Show Tour Marker
Tour markers are displayed when the tour marker icon ![]() is selected.
is selected.
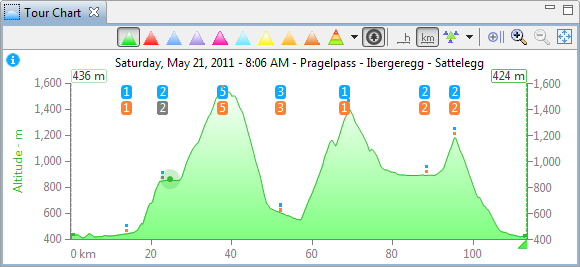
Tour Marker Slideout
When the tour marker icon ![]() is selected and is hovered with the mouse, the tour marker slideout is displayed. This slideout contains several options how to display the tour markers. Some options have tooltips which show more info about the option.
is selected and is hovered with the mouse, the tour marker slideout is displayed. This slideout contains several options how to display the tour markers. Some options have tooltips which show more info about the option.
Context Menu
These actions are described here.
Create Tour Marker
A tour marker can be created with the mouse in the tour chart.
|
Where |
Description |
|---|---|
|
Mouse position |
Move the mouse to the horizontal position where the tour marker should be created and select |
|
Vertical slider position |
Move the mouse over a vertical slider and select |
|
Tour Editor |
A tour marker can also be created in the tour editor |
Photo Marker
A photo marker displays the number of photos at the horizontal position where photos are available within a tour.
Requirements to display photo markers in the tour chart:
- A tour must be selected in a view which contains saved photos or a tour must be selected the
 Photos + Tours view
Photo Tooltip
When a photo marker is hovered with the mouse and this ![]() photo icon is displayed in the toolbar , a photo tool tip pops up to display all photos contained in this photo marker.
photo icon is displayed in the toolbar , a photo tool tip pops up to display all photos contained in this photo marker.

Photo Marker Properties
The photo markers are differently displayed depending on the current situation.
Photo link marker
When a tour is selected the ![]() Photos + Tours view, hovered photo markers are displayed like
Photos + Tours view, hovered photo markers are displayed like ![]()
Tour photo marker
When photos are saved in a tour, hovered photo markers are displayed like ![]()
Tour photo + photo link marker
When photos are saved in a tour and this tour is selected the ![]() Photos + Tours view, this applies:
Photos + Tours view, this applies:
|
This is a photo link marker |
|
|
|
This is a tour photo marker |
|
|
This photo marker is hovered with the mouse |
This is the same chart as above but the time is adjusted in the ![]() Photos + Tours view and the photos are not yet saved again.
Photos + Tours view and the photos are not yet saved again.
This page is updated for version 21.12
